Science first
Predictions start from published crop-science models of how yield responds to nitrogen, heat and water. Machine learning refines that foundation; it does not replace it.
The science
Short, plain-language explainers on the ideas the platform is built on. No sales pitch: just the science, the way we would explain it across the kitchen table.
How we build
Three rules sit behind every number the platform shows.
Predictions start from published crop-science models of how yield responds to nitrogen, heat and water. Machine learning refines that foundation; it does not replace it.
Recommendations come with their reasoning: the prices and assumptions used, both layers of a prediction, and how the answer was reached.
Farming is uncertain. Readiness scores carry a confidence score, predictions carry a confidence label, and nothing is presented as more certain than it is.
Explainers
Each one ends with what the platform does with the idea, and whether that part is live or in pilot.
Crop growth
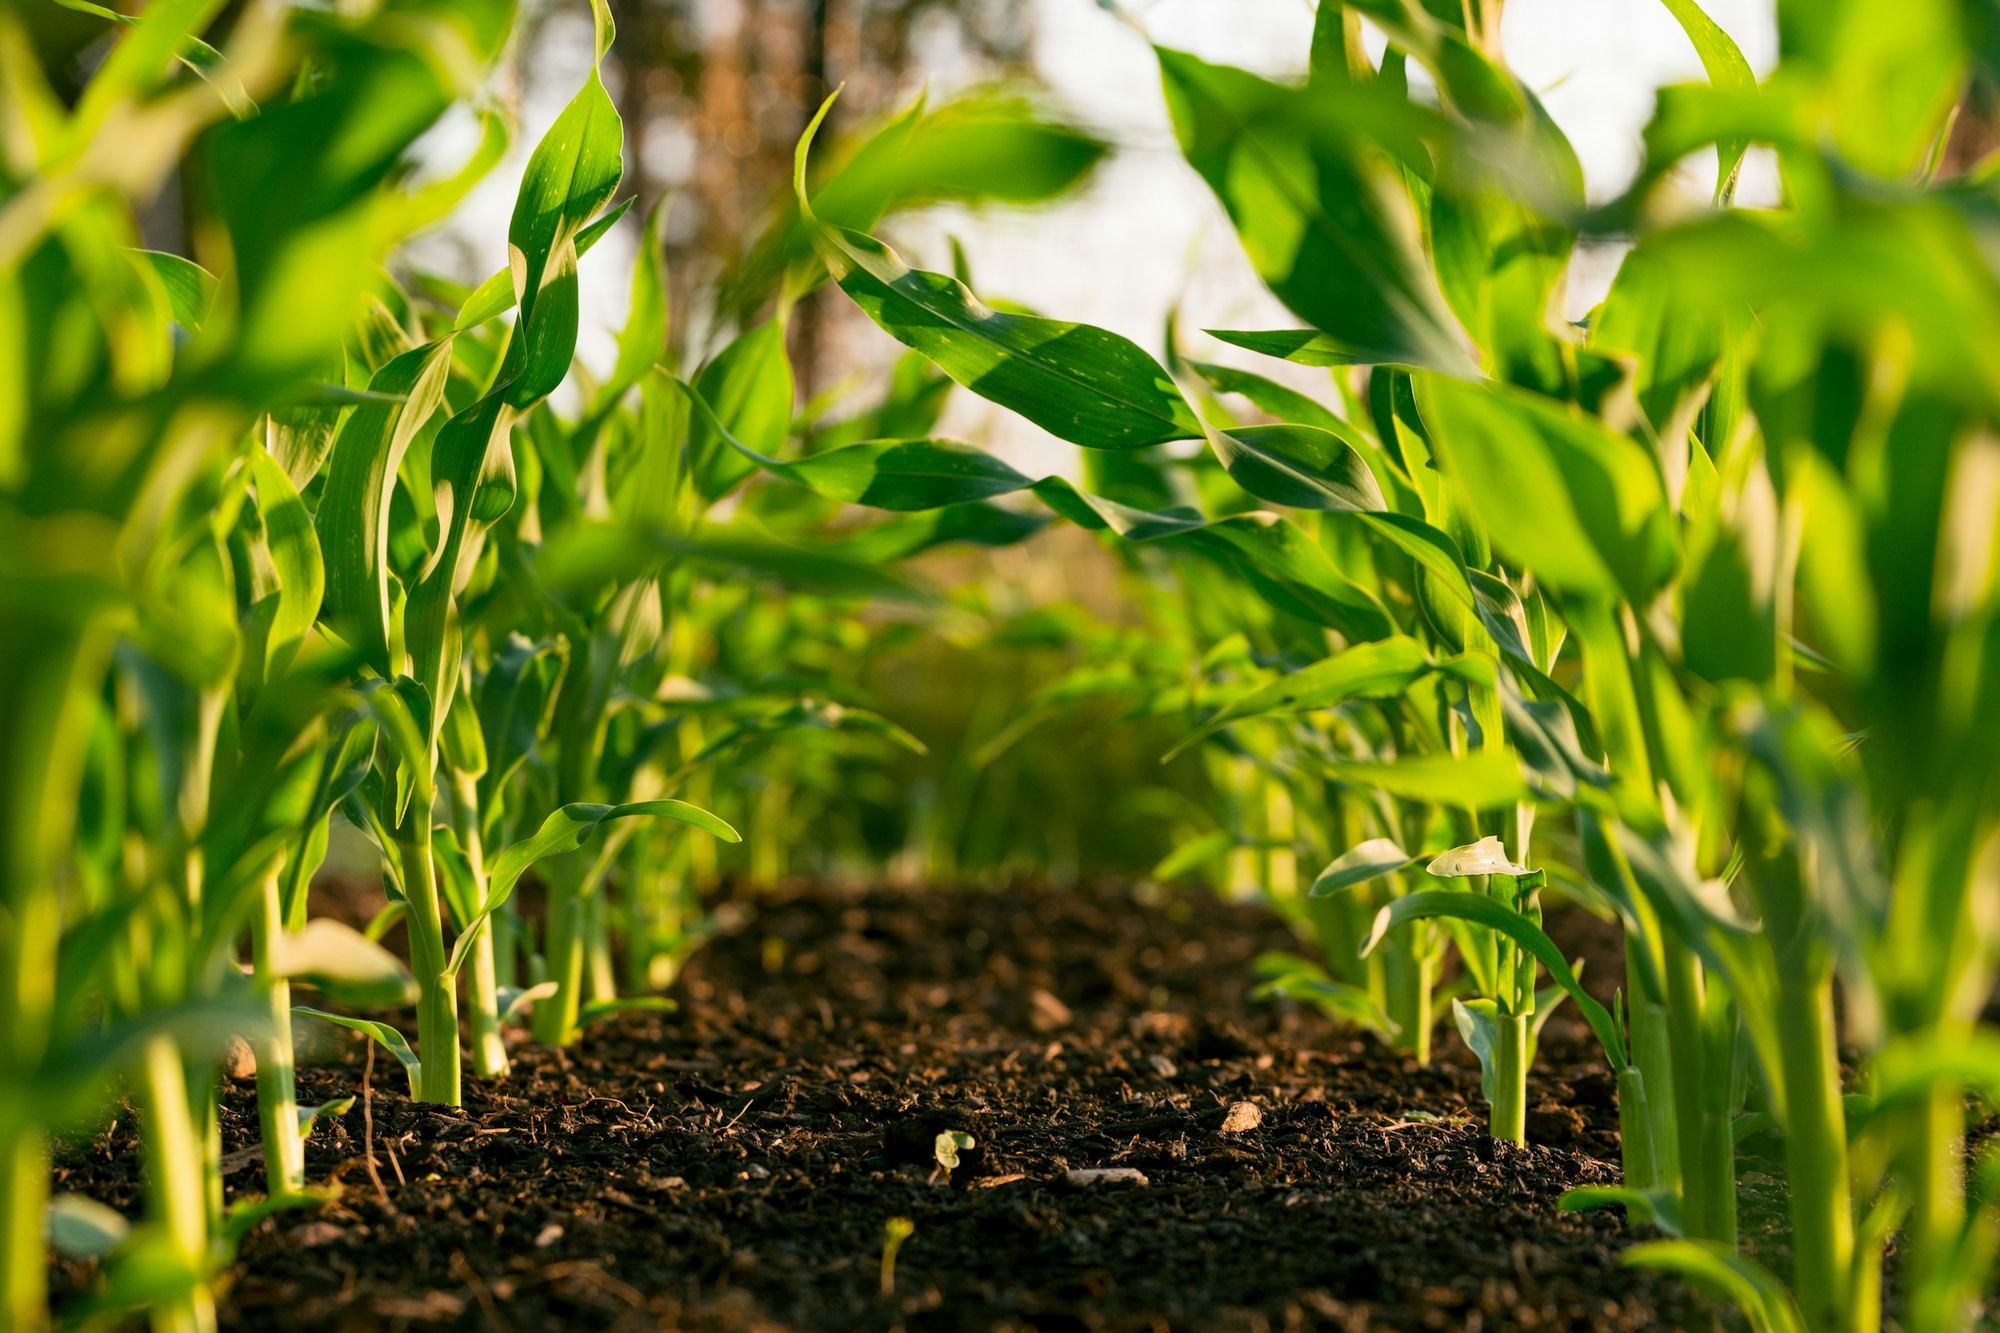
Crops develop by heat, not by the calendar. Growing Degree Days (GDD) add up the useful warmth a crop receives each day above a base temperature: about 5 °C for canola. A warm week moves a crop further along than a cool one, even though both are seven days long.
Because each growth stage arrives at a fairly predictable heat total, a running GDD count tells you when a paddock will reach its next stage, and when decisions such as nitrogen timing matter most.
Daily GDD = (max temp + min temp) ÷ 2 − base temp
Example for canola: a day of 17 °C and 5 °C gives (17 + 5) ÷ 2 − 5 = 6 GDD.
In AgrivaCT Pilot
In the canola pilot, GDD are counted from each zone’s sowing date using that zone’s daily temperatures, so every zone has its own stage.
Fertiliser
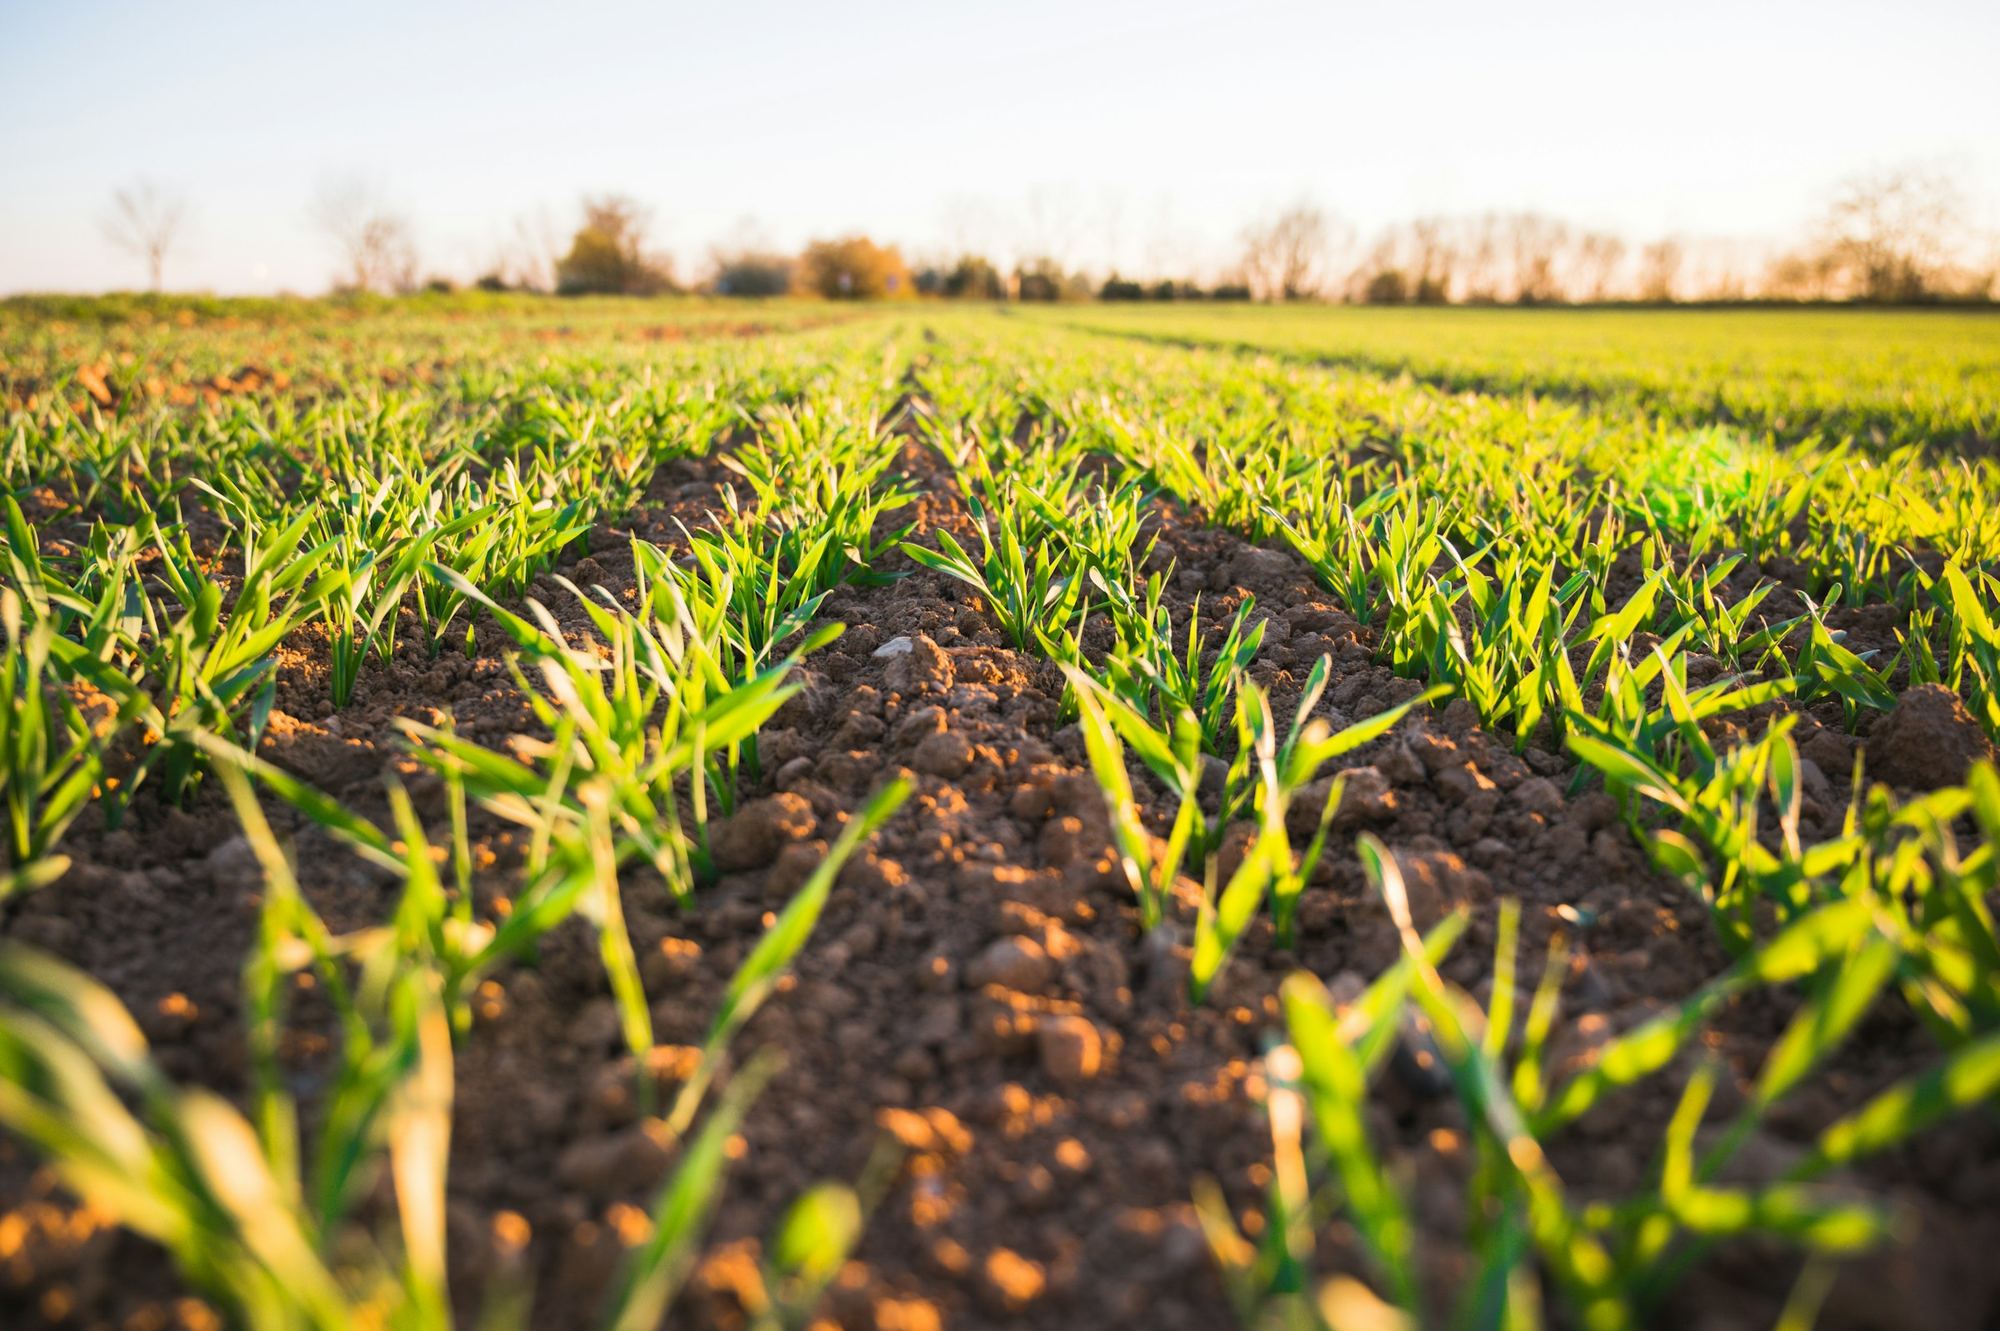
Soil type, organic matter and water-holding capacity can change within a few hundred metres, so different parts of one paddock need different amounts of nitrogen.
One rate across the whole paddock over-applies where the soil already supplies enough, paying for fertiliser the crop cannot use, and under-applies where yield potential is highest, leaving grain in the paddock. Matching the rate to each zone’s need saves at both ends.
One paddock, many needs. A single rate fits none of them exactly.
In AgrivaCT Live
Today, the map, probes and zone weather show how each zone differs. In the canola pilot, a nitrogen rate is recommended for each zone rather than one for the paddock.
Prediction
Crop-science formulas describe how crops respond on average. Every farm has patterns those averages miss, such as how a dry spell hits one particular soil. A model trained on weather and soil records can learn patterns like these.
The key is how the two are combined. Using the formula as the baseline and letting the model correct it, rather than replace it, keeps a prediction grounded in established science. It also means you can always see how much of a number came from each part.
Prediction = science-based baseline + learned correction
In AgrivaCT Pilot
The pilot uses an XGBoost model as the correction layer and shows both layers. It is provisional: it is trained on simulated canola seasons and has not yet been validated on real paddocks.

Economics
Nitrogen use efficiency (NUE) measures how much crop you get back for each kilogram of nitrogen applied. Low NUE means fertiliser is being lost, washed below the roots or released into the air, instead of feeding the crop.
Improving NUE usually means a lower cost per tonne, a better margin and less nitrogen leaving the paddock. It is the clearest single signal that your nitrogen is doing its job.
NUE (simplest form) = grain yield ÷ nitrogen applied
In AgrivaCT Pilot
The pilot reports NUE beside fertiliser cost, revenue and margin for each zone.
Two ideas, drawn
Two pictures that explain most of what the canola pilot does: heat drives the crop’s stage, and the best nitrogen rate is where the return peaks.
The same crop reaches the same stage when it has banked the same heat. In a warm season that simply happens sooner.
More nitrogen raises yield up to a point. Past it, every extra kilogram costs more than the grain it adds.
The yield model · Pilot
The canola pilot predicts yield in two layers, so you can always see how much of a number came from established science and how much from the learned correction.
The starting point
Published agronomic formulas for how canola yield responds to nitrogen, heat and water. Every prediction starts here.
The adjustment
An XGBoost model adjusts the baseline where weather and soil patterns differ from the average. It corrects; it never replaces.
The answer
Expected yield with both layers visible, a High or Low confidence label, and the nitrogen rate with the best return.
Honest about uncertainty
Two different signals, each telling you how much weight to put on a number.
Each readiness score comes with a 0–100 confidence score. Measured soil data from a probe in the zone counts for more than weather alone, so a weather-only zone is capped at 70.
Zone A · probe
Ready
Confidence88
Measured by the zone’s probe, with weather as a cross-check
Zone C · weather only
Conditional
Confidence70
Weather only: capped at 70 until a probe adds measured soil data
Two independent machine-learning models estimate the correction. When they broadly agree the prediction is labelled High; when they disagree it is labelled Low. It is a simple rule, stated plainly, not a statistical guarantee.
Zone A
2.1t/ha predicted
Confidence: High The two models agree.
Zone B
1.6t/ha predicted
Confidence: Low The two models disagree. Treat with care.
Illustrative data
See it on your farm
Every explainer here maps to something the platform does, live or in pilot. We are happy to walk you through it.