Dashboard & app

Your whole farm, zone by zone.

Every zone on one map, with its own soil readings, hourly weather, seeding readiness and field records. On the web and on your phone.

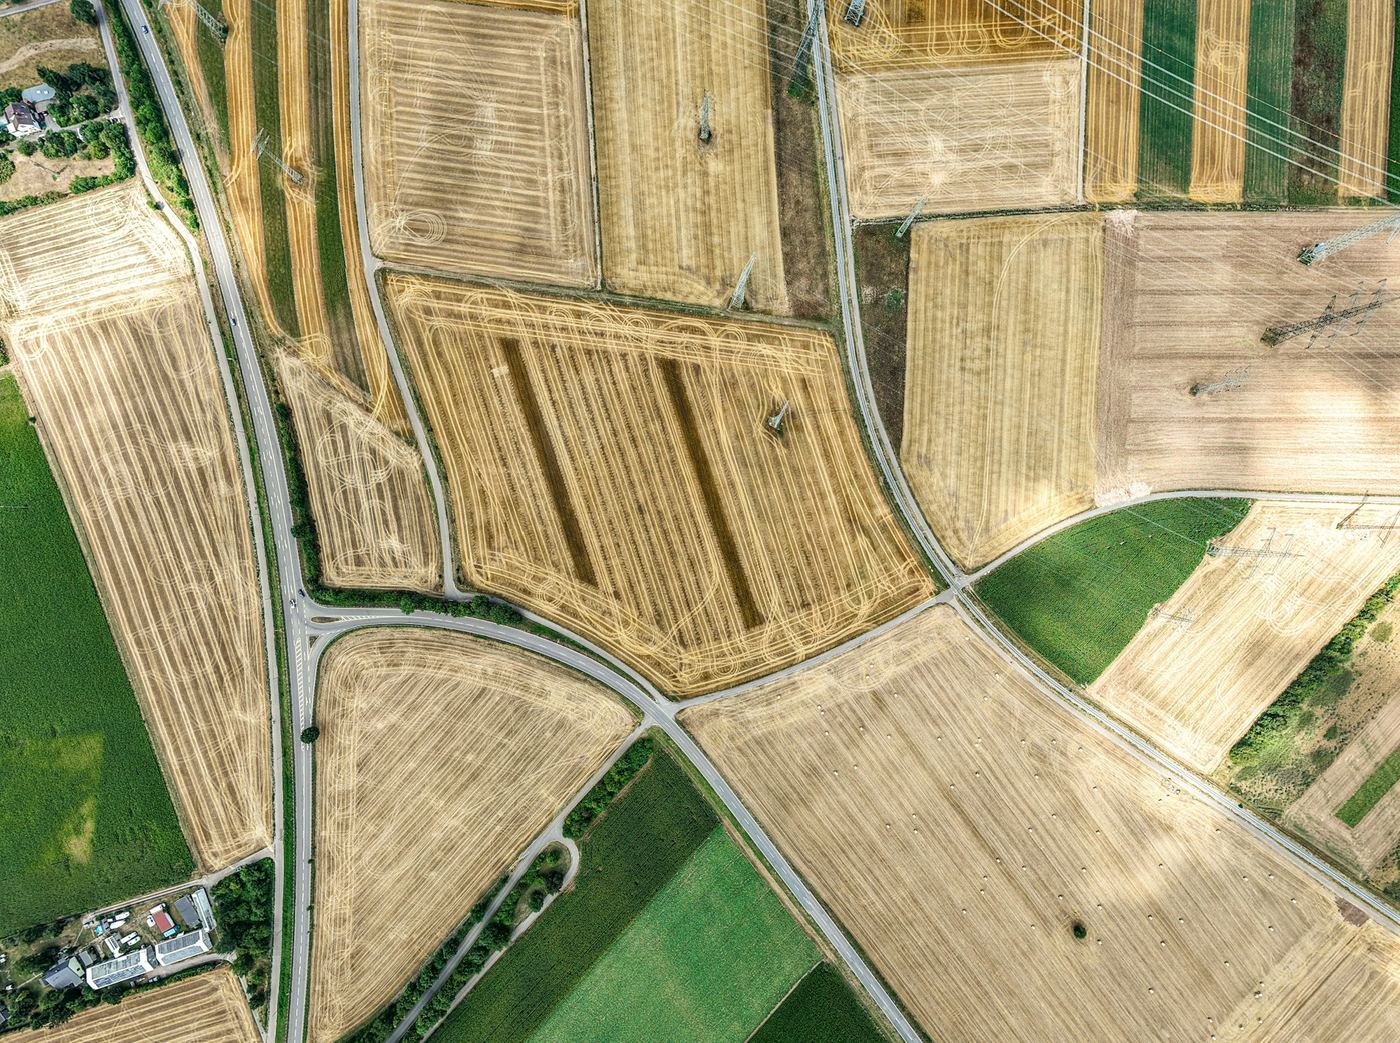
Aerial view of a patchwork of farm paddocks
  • North flatZone A · Canola
  • 14°C · 4.2 mmWeather, every hour
  • Ready · 82Seeding readiness
Illustrative data

Choose a zone to see its data

Example farm · 4 zones · 3 probes online

Farm map & zones

Zone A: North flatZone B: Creek paddockZone C: RidgeZone D: South block A B C D
A

North flat

Canola · 46 ha

Probe online · 4 min ago86%LTE-M · good

Seeding readiness Live

82/ 100

Ready for canola sowing

Confidence88

Measured by the zone’s probe, with weather as a cross-check

Weather · zone A Live

  • Now14°C
  • Rain 24 h4.2 mm
  • Wind12 km/h
  • Humidity71%
  • ET₀2.1 mm
°C 10 15 06:00 · 8 °C · 0 mm07:00 · 9 °C · 0 mm08:00 · 11 °C · 0 mm09:00 · 12 °C · 0.2 mm10:00 · 14 °C · 0.6 mm11:00 · 15 °C · 1.4 mm12:00 · 15 °C · 1.1 mm13:00 · 16 °C · 0.5 mm14:00 · 17 °C · 0.2 mm15:00 · 17 °C · 0 mm16:00 · 16 °C · 0.2 mm17:00 · 14 °C · 0 mm 17° mm 09:00 · 0.2 mm10:00 · 0.6 mm11:00 · 1.4 mm12:00 · 1.1 mm13:00 · 0.5 mm14:00 · 0.2 mm16:00 · 0.2 mm 06:0008:0010:0012:0014:0016:00

Soil · measured Live

Moisture
31%
Soil temp
12.4°C
EC
410µS/cm
pH
6.4
N
38mg/kg
P
22mg/kg
K
165mg/kg

Moisture · last 14 daysprobe

Growth stage Pilot

412GDD since sowing

RosetteBud

88 GDD to the next stage · base 5 °C

Yield prediction Pilot

2.1t/ha predicted

  • Crop-science baseline 1.9
  • ML correction +0.2

Confidence: High The two models agree.

Nitrogen Pilot

80kg N/ha recommended

  • Fertiliser costA$96/ha
  • Price assumedA$1.20/kg N
  • Already applied20 kg N/ha

Reasoning shown in the app

Recreated from the AgrivaCT dashboard · illustrative data · panels marked Pilot are in testing

Live in the product today

Everything you need to know about each zone.

The monitoring core is working now: probes, map, zone weather, seeding readiness and field records, on the web and the app.

Live

Draw your farm the way you manage it.

Outline your farm on satellite imagery, then split it into zones by soil, crop or however you already work the land. From then on, every zone is tracked on its own.

  • Farm boundaries and zones drawn as polygons, rectangles or circles
  • Probes placed on the map and assigned to their zone
  • Each zone keeps its own readings, weather and records
A · North flat B · Creek paddock C · Ridge D · South block
Illustration of the farm map
Live

Live and historical soil data

Every probe reading per zone, with fortnightly season snapshots from the day the zone was created.

Live

Remote probe management

Set sampling and reporting intervals, enabled sensors and calibration from the dashboard, and inspect every packet a probe sends.

Live

Team access

Invite agronomists and staff, give each person a role, and limit access farm by farm.

Live

Four languages

The dashboard runs in English, Hindi, Marathi and Telugu.

Zone intelligence · Live

One zone, through a whole season.

From the day you draw a zone, the platform keeps a snapshot of it every fortnight: weather, probe readings and N, P and K by date, with a two-week forecast on the end. Scroll through one season in zone A.

Skip animation

Illustrative data

  1. 1 April

    Step 1: The zone goes on the map.

    Draw zone A and assign its probe. From that day on, the platform keeps a snapshot of the zone every fortnight.

    Live today
  2. Every fortnight

    Step 2: A snapshot every two weeks.

    Each snapshot holds the zone’s weather, its probe readings and its N, P and K by date. Here, autumn rain lifts the soil moisture.

    Live today
  3. Mid May

    Step 3: The zone becomes ready to sow.

    Seeding readiness checks moisture, soil temperature and pH against canola thresholds. Once they line up, the zone turns Ready, with its confidence beside it.

    Live today
  4. After sowing

    Step 4: The crop builds up heat.

    In the canola pilot, Growing Degree Days (base 5 °C) count up from the zone’s sowing date and show how close the crop is to its next stage.

    In pilot
  5. Today

    Step 5: A look two weeks ahead.

    The timeline runs past today into a two-week forecast for the zone, so the next decision starts with what is coming.

    Live today

Canola decision support · Pilot

What to do next, and whether it pays.

Built for canola and being tested before general release: growth stage from heat units, a two-layer yield prediction and the nitrogen rate with the best return, zone by zone.

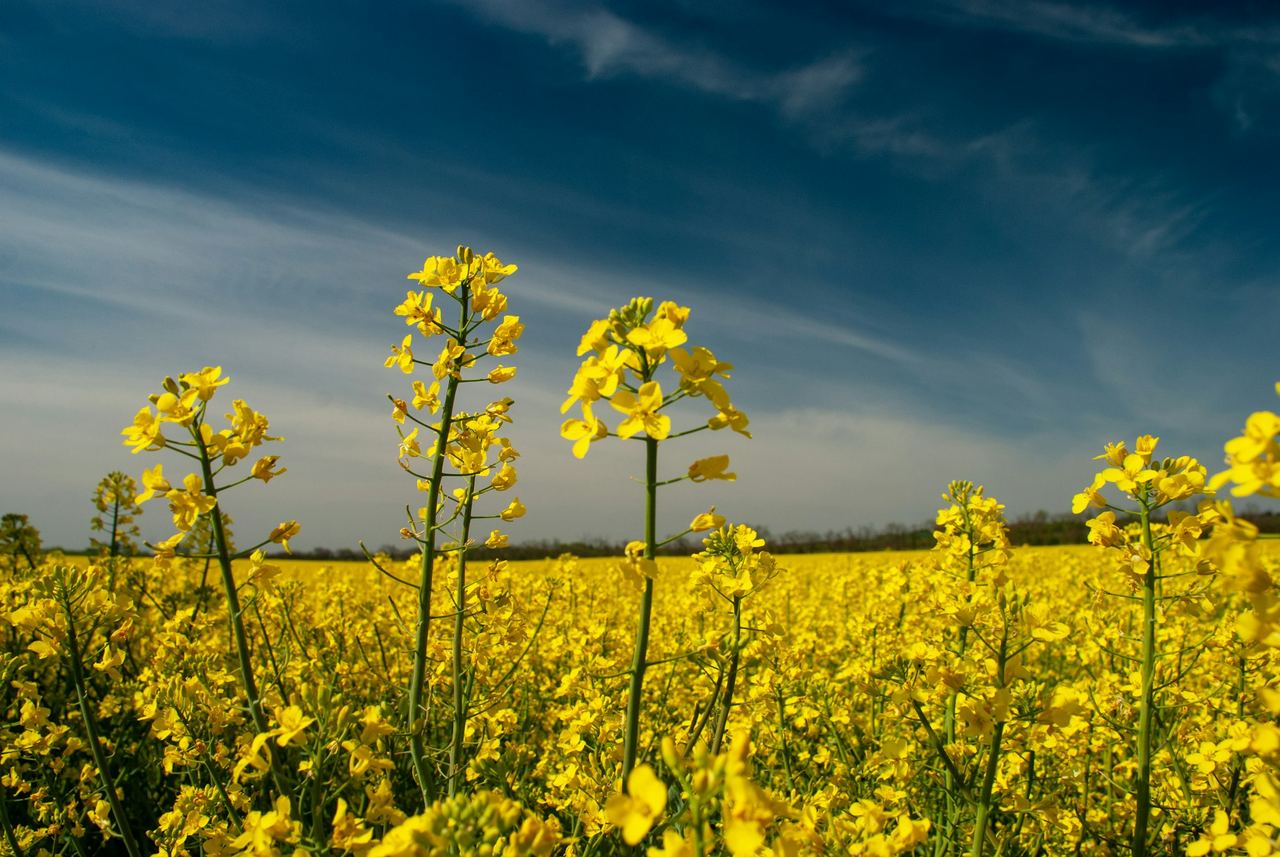
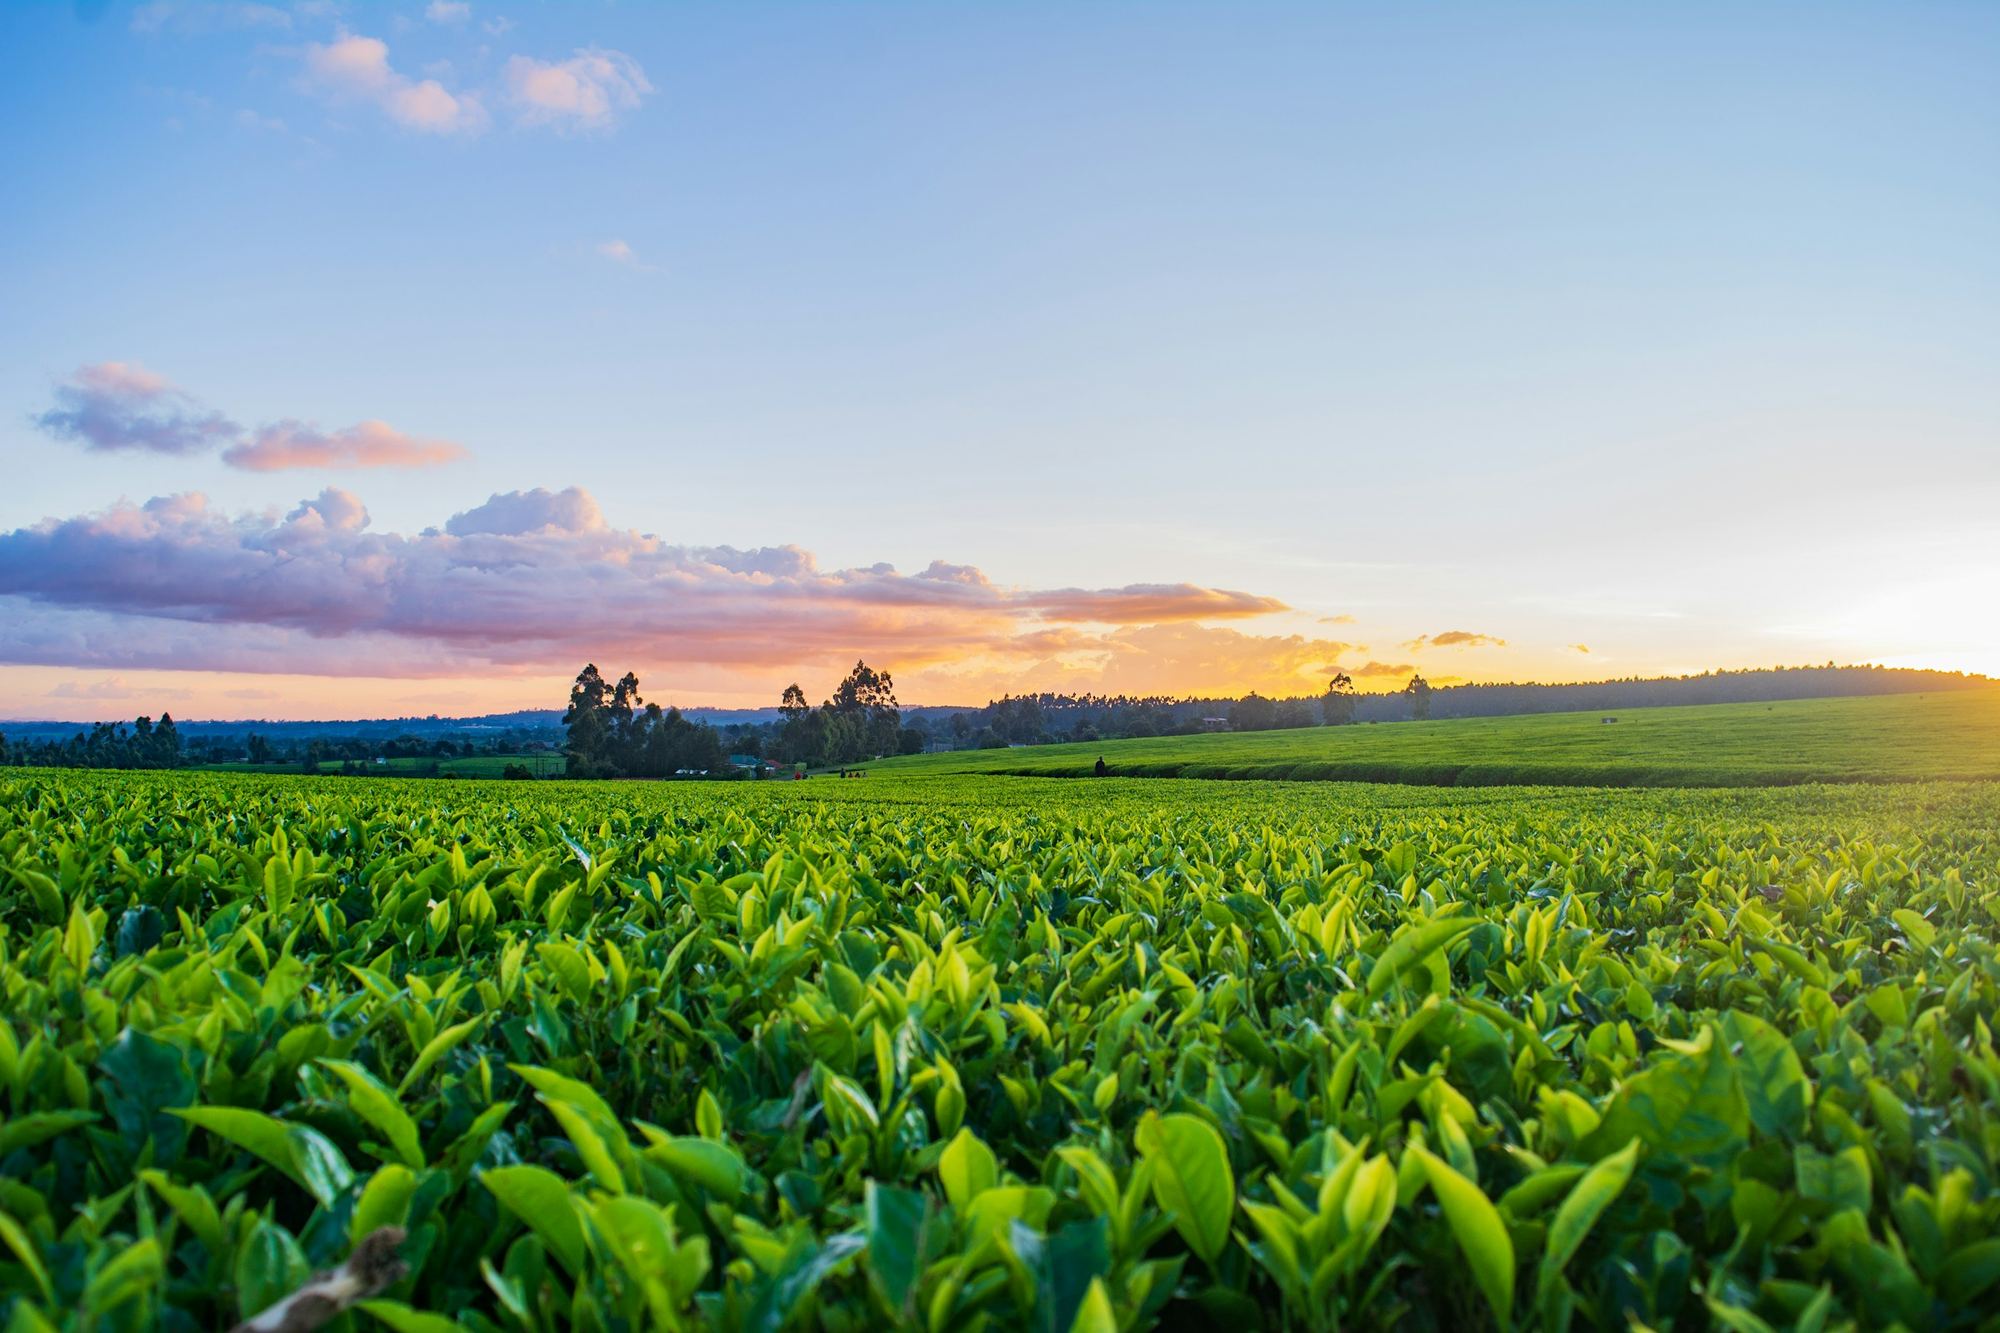
Canola in flower against an evening sky
Zone A · growth stageRosette · 88 GDD to Bud
  • Growth stage from heat units

    Growing Degree Days, counted from each zone’s sowing date, show which stage a canola crop has reached.

  • Two-layer yield prediction

    A crop-science baseline corrected by a machine-learning model. Both layers are shown, with a High or Low confidence label.

  • The nitrogen rate that pays

    A range of rates evaluated for each zone, with fertiliser cost, expected revenue and margin laid out, and how the answer was reached.

  • Applications remembered

    Record what you actually applied. It is carried into later recommendations, and its effect fades over time.

  • Economics per zone

    Cost, revenue, margin and nitrogen use efficiency for each zone, side by side.

Finding the nitrogen rate that actually pays Pilot

Net return by nitrogen rate (illustrative) Net return per hectare rises as the nitrogen rate increases, peaks at the rate with the best return, then falls as extra fertiliser costs more than the yield it adds. Best return in this example Best return Under-applied Over-applied 060120180240 Nitrogen rate (kg N/ha) Net return per hectare
Illustrative. Left of the peak, yield is left in the paddock. Right of it, extra fertiliser costs more than the grain it adds.

Two layers, and a clear measure of confidence.

Every yield prediction shows the crop-science baseline and the machine-learning correction separately. A High or Low label says whether two independent models agree, so you know how much weight to give the number.

How the two layers work

ANorth flat Pilot

2.1t/ha predicted

  • Crop-science baseline 1.9
  • ML correction +0.2

Confidence: High The two models agree.

BCreek paddock Pilot

1.6t/ha predicted

  • Crop-science baseline 1.8
  • ML correction −0.2

Confidence: Low The two models disagree. Treat with care.

Illustrative data

See it on your farm

Put every zone on one map.

Start with probes in the zones that matter most. We will help you set up the map and zones.